
What Is Technical Analysis? A Plain-English Introduction to Reading Forex Charts


Look at a forex chart for the first time and it can feel like reading a language you've never seen. Red and green bars, lines everywhere and indicators you've never heard of.
The good news is that you don't need to understand everything at once. This guide covers the basics of technical analysis in plain English, so you can start reading charts with more confidence.
What Is Technical Analysis?
Technical analysis is a way of studying past price movements on a chart to help decide when to buy, sell or stay out.
It rests on a few simple ideas:
• Price reflects what traders know and feel. News, expectations and emotions all show up in price.
• Prices tend to move in trends. Once a direction is set, it often continues for a while.
• Patterns can repeat. Because human behaviour repeats, similar chart patterns can appear again and again.
The other main approach is fundamental analysis, which looks at economic news, interest rates and data. Many traders use a mix of both.
How to Read a Candlestick
Most traders use candlestick charts. Candlesticks date back to Japanese rice traders in the 1700s, and they are still the most popular chart type today.
Each candle shows four prices for a chosen period, such as one hour or one day:
• Open: where the price started.
• Close: where the price ended.
• High: the highest point reached.
• Low: the lowest point reached.
The thick part is called the body. The thin lines above and below are the wicks. A green (or white) candle usually means price closed higher than it opened. A red (or black) candle means it closed lower.
Quick Tip: Long wicks tell a story. A long lower wick shows sellers pushed price down, but buyers pushed it back up before the candle closed.
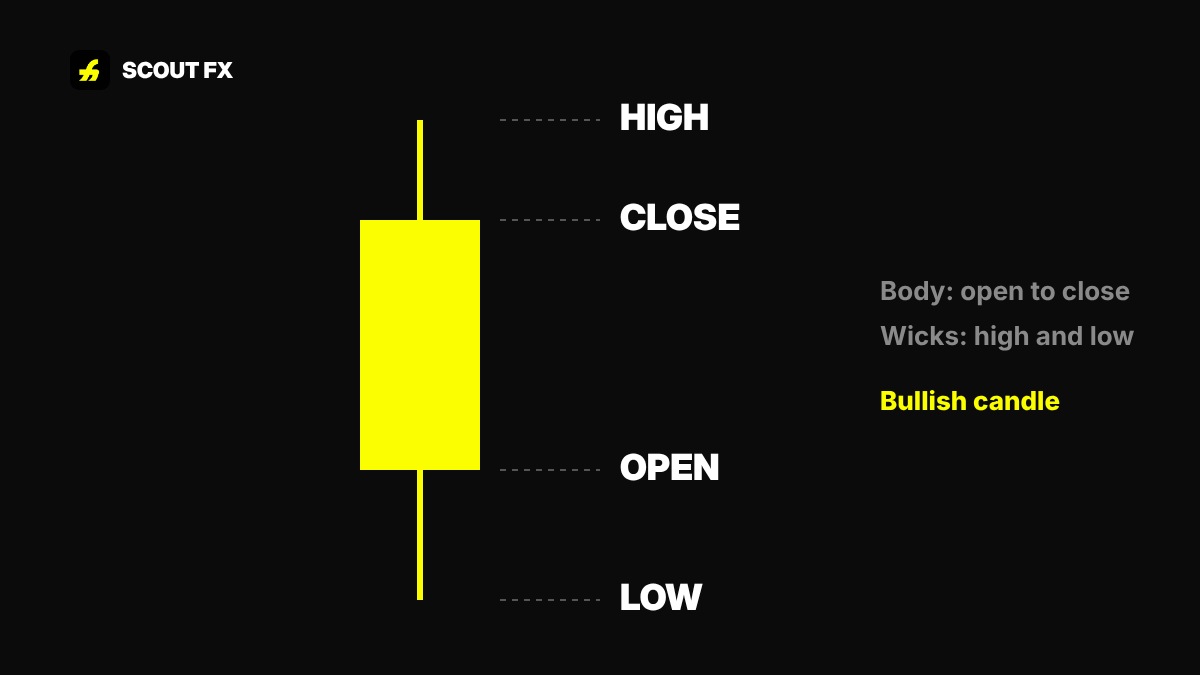
Each candle shows the open, high, low and close for a chosen period.
Spotting the Trend
A trend is the general direction of price.
Trend | What price does | What it suggests |
Uptrend | Higher highs and higher lows | Buyers are in control |
Downtrend | Lower highs and lower lows | Sellers are in control |
Range | Moves sideways between two levels | Neither side is in control |
A simple way to start: zoom out to a higher timeframe, such as the daily or 4-hour chart, and ask, "Is price generally going up, down or sideways?" Many traders prefer to trade in the direction of the main trend.
Support and Resistance Levels
Support is a price level where falling prices have tended to stop and bounce. Think of it as a floor.
Resistance is a level where rising prices have tended to stop and turn down. Think of it as a ceiling.
These levels matter because many traders watch them, so price often reacts there. When a strong level breaks, it can become the opposite: old resistance can turn into new support.
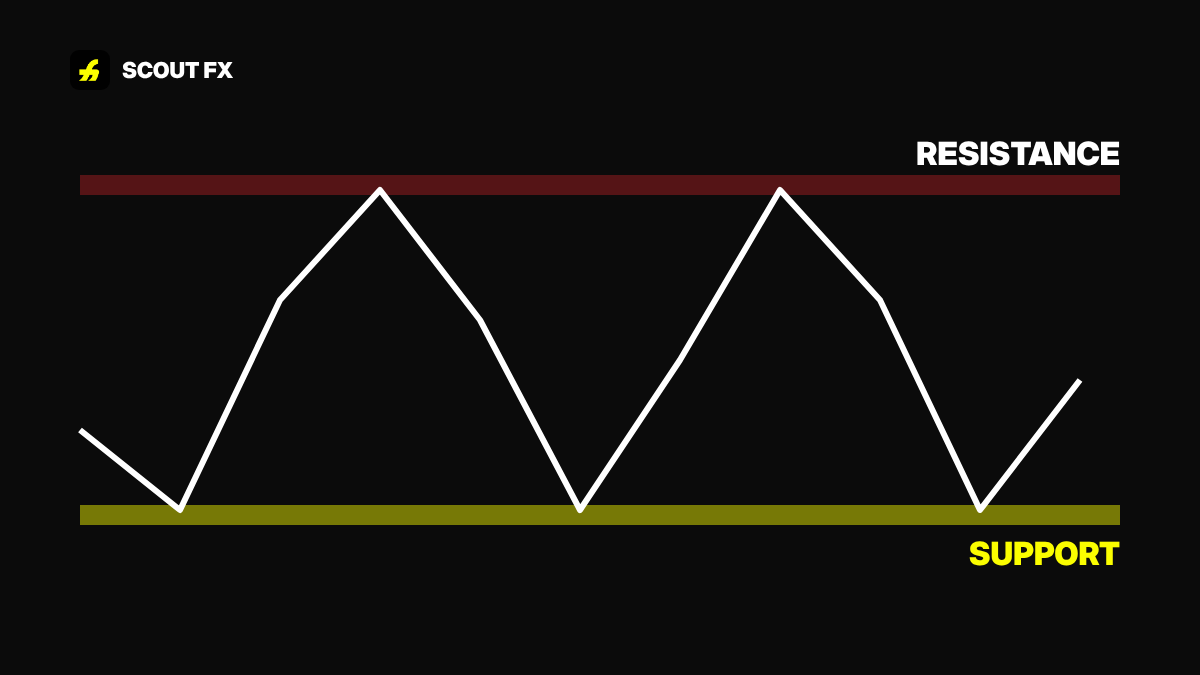
Support is where price has tended to stop falling. Resistance is where it has tended to stop rising.
Indicators Beginners Should Know
Indicators are tools calculated from price. They help you measure things like trend and momentum.
• Moving averages smooth out price to show the trend more clearly. A common example is the 50-period moving average.
• RSI (Relative Strength Index) shows momentum on a scale of 0 to 100, with 70 and 30 as common reference levels.
• MACD compares moving averages to show changes in momentum.
Start with one or two. A chart covered in ten indicators is harder to read, not easier.
Watch Out: No chart pattern or indicator works every time. Technical analysis improves your odds. It does not remove risk, so every trade still needs a stop loss.
Timeframes Explained
The same pair can look very different on different timeframes. A pair can be falling on the 15-minute chart while rising on the daily chart.
A simple approach is to use a higher timeframe to find the trend and a lower one to time your entry. For example, use the daily chart for direction and the 1-hour chart for entries.
Questions
Is technical analysis reliable?
It can be useful, but it is based on probabilities. Many patterns fail, which is why risk management matters.
Do I need fundamental analysis too?
Not always, but you should at least know when major news is due, because news can override any chart pattern.
What is the best chart for beginners?
Candlestick charts are the most popular and give the most information at a glance.
How long does it take to learn technical analysis?
You can learn the basics in a few weeks, but reading charts well takes months of regular practice on a demo account.

Written by
Coach Emma
Founder and lead educator, Scout FX
Coach Emma founded Scout FX to teach trading the honest way: fundamentals first, risk before reward, and no get-rich-quick promises. Through free seminars, live sessions and the Scout FX community, Emma has helped more than 4,000 people across Ghana understand how the forex and gold markets really work.
This article is education, not financial advice or a trade recommendation. Trading forex, gold and crypto carries a high level of risk. Read the risk disclosure before you trade.