
RSI Indicator Explained: How to Read Overbought and Oversold Signals in Forex Trading


Open almost any trading chart and you'll find RSI in the indicator list. It's one of the most popular tools in forex, and also one of the most misunderstood.
Many beginners see RSI hit 70 and sell immediately, only to watch the price keep climbing. This guide explains what RSI actually tells you and how to use it sensibly.
What Is the RSI Indicator?
The Relative Strength Index, or RSI, is a momentum indicator. It compares the size of recent gains with the size of recent losses to show how strong a move has been.
It was developed by J. Welles Wilder Jr. and introduced in his 1978 book, New Concepts in Technical Trading Systems. Wilder used 14 periods, and that remains the default setting on most platforms today. On a 1-hour chart, that means the last 14 hours. On a daily chart, the last 14 days.
RSI is shown as a line in a separate window below your chart, moving between 0 and 100.
How RSI Is Calculated
You don't need to calculate it yourself, because your platform does it for you. But it helps to understand the idea:
RSI = 100 − (100 ÷ (1 + RS))
Where RS is the average gain divided by the average loss over the chosen period.
In simple terms: if recent candles have mostly closed higher, RSI rises. If they have mostly closed lower, RSI falls.
RSI Overbought and Oversold Levels
RSI reading | Traditional meaning |
Above 70 | Overbought: buying may be stretched |
30 to 70 | Neutral range |
Below 30 | Oversold: selling may be stretched |
"Overbought" means price has risen quickly and may be due a pause or pullback. "Oversold" means price has fallen quickly and may be due a bounce.
Watch Out: In a strong trend, RSI can stay above 70 or below 30 for a long time. Selling every time RSI hits 70 in a strong uptrend is one of the most common beginner mistakes.
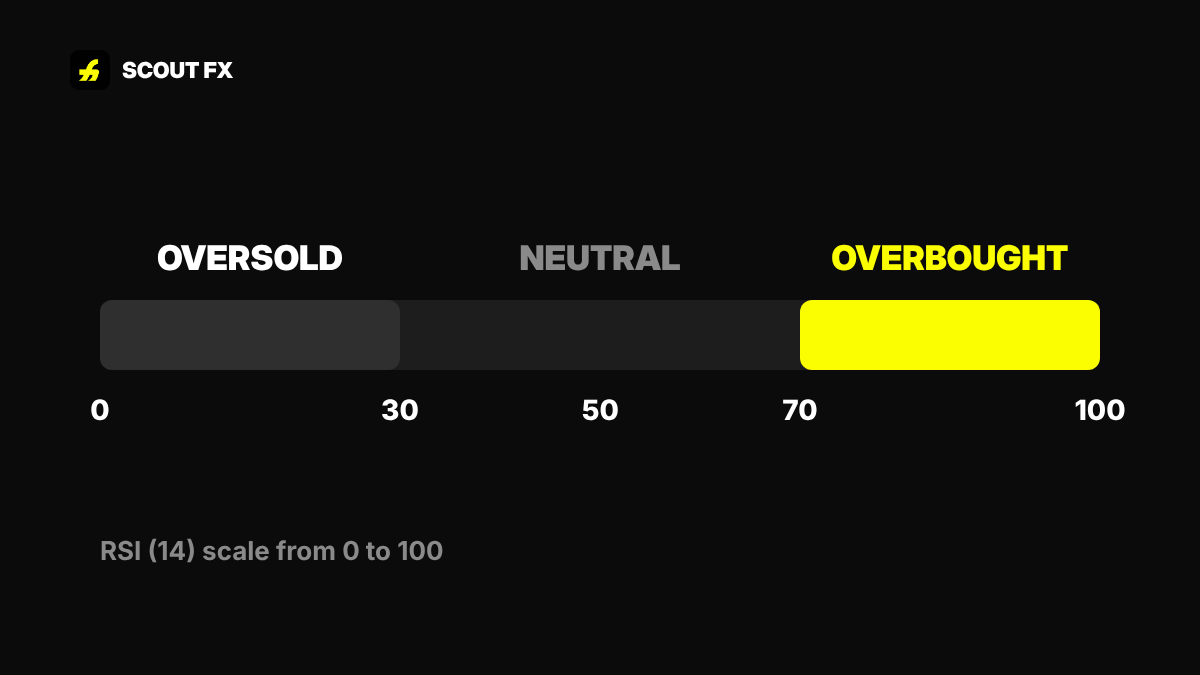
RSI moves between 0 and 100. Above 70 is traditionally overbought, below 30 is oversold.
How to Use RSI in Forex
1. Use it with the trend.
In an uptrend, look for RSI to dip towards 40 or the oversold area during pullbacks as a possible buying opportunity, rather than selling at 70. In a downtrend, do the opposite.
2. Combine it with key levels.
An oversold RSI reading at a strong support level is more meaningful than an oversold reading in the middle of nowhere.
3. Watch the 50 line.
RSI above 50 suggests buyers have more control. Below 50 suggests sellers do. Some traders use this as a simple trend filter.
4. Confirm before acting.
Wait for price to show a reaction, such as a strong candle in your direction, before entering.
Quick Tip: Stick with the default 14 setting while you learn. Changing settings constantly makes it harder to understand what the indicator is telling you.
RSI Divergence Made Simple
Divergence happens when price and RSI disagree.
• Bearish divergence: price makes a higher high, but RSI makes a lower high. The uptrend may be losing strength.
• Bullish divergence: price makes a lower low, but RSI makes a higher low. The downtrend may be losing strength.
Wilder saw divergence as an important warning sign. Still, it is a warning, not a guarantee. Trends can continue even after divergence appears.
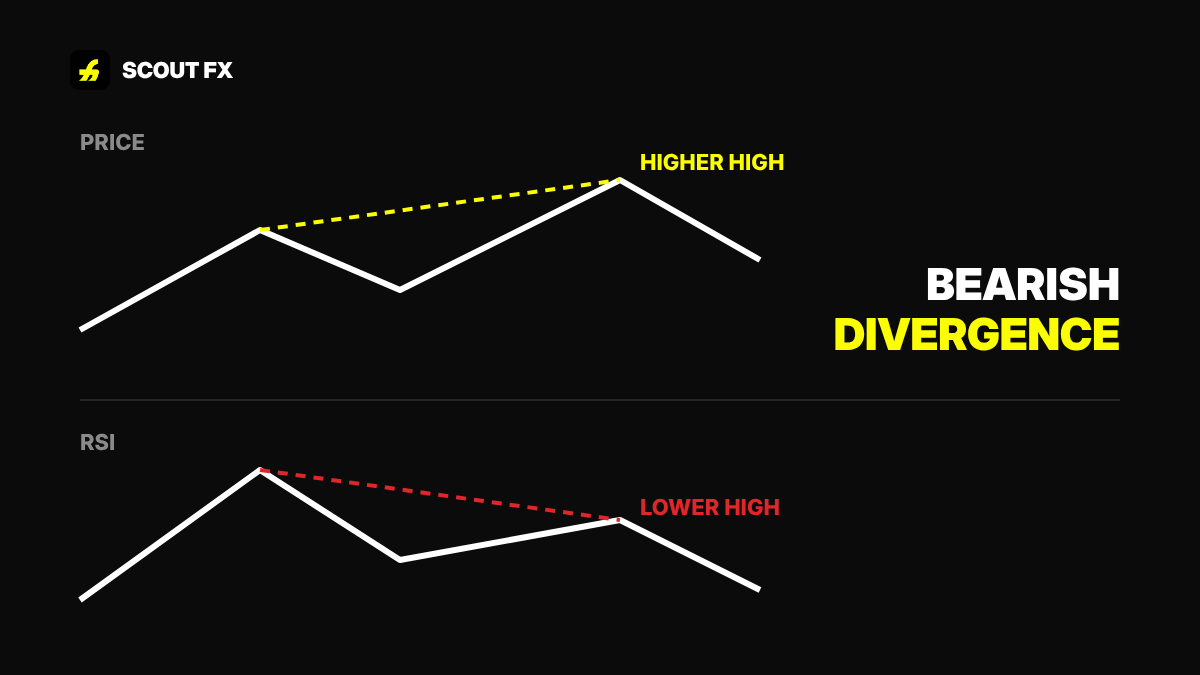
Bearish divergence: price makes a higher high, but RSI makes a lower high, a sign the move may be losing strength.
Common RSI Mistakes
• Treating 70 as an automatic sell signal and 30 as an automatic buy signal.
• Using RSI alone without looking at the trend or price levels.
• Trading against a strong trend because RSI looks "too high."
• Changing settings after every losing trade.
Forgetting risk management. No indicator removes the need for a stop loss
Questions
What is the best RSI setting for forex?
The default 14-period setting is a good place to start. It is the original setting and the one most traders use.
Is RSI good for beginners?
Yes. It is simple to read, but it should be used with trend direction and support and resistance, not on its own.
What does RSI 50 mean?
It means recent gains and losses are roughly balanced. Many traders see readings above 50 as bullish and below 50 as bearish.
Can RSI predict price?
No indicator can predict price. RSI shows momentum, which can help you judge whether a move is strong or fading.

Written by
Coach Emma
Founder and lead educator, Scout FX
Coach Emma founded Scout FX to teach trading the honest way: fundamentals first, risk before reward, and no get-rich-quick promises. Through free seminars, live sessions and the Scout FX community, Emma has helped more than 4,000 people across Ghana understand how the forex and gold markets really work.
This article is education, not financial advice or a trade recommendation. Trading forex, gold and crypto carries a high level of risk. Read the risk disclosure before you trade.